Mastering Microsoft Sentinel POC: The Missing Security Layer for AzureAD, Microsoft 365 and XDR”
Explains why Sentinel is needed even when using Microsoft 365 E5, Defender XDR and AzureAD, and how it unifies detection, investigation, and monitoring.
We built a cloud security POC lab that watches everything happening in our Microsoft 365, XDR and AzureAD environment, like a high-tech security camera system, but for digital stuff. If someone does something sketchy (or just plain weird), we get an alert. Think of it as your company's IT bouncer, minus the sunglasses and attitude.
Phase 1: Setting Up Our Digital Fortress (Azure AD Tenant)
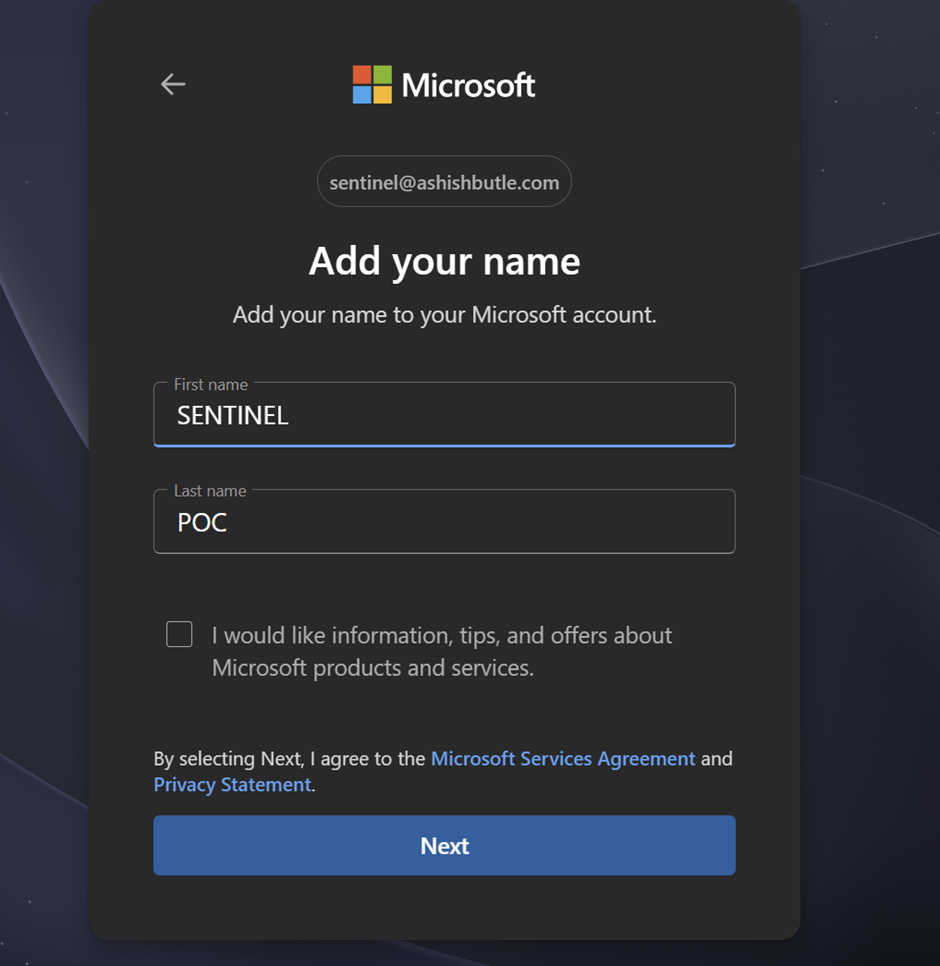
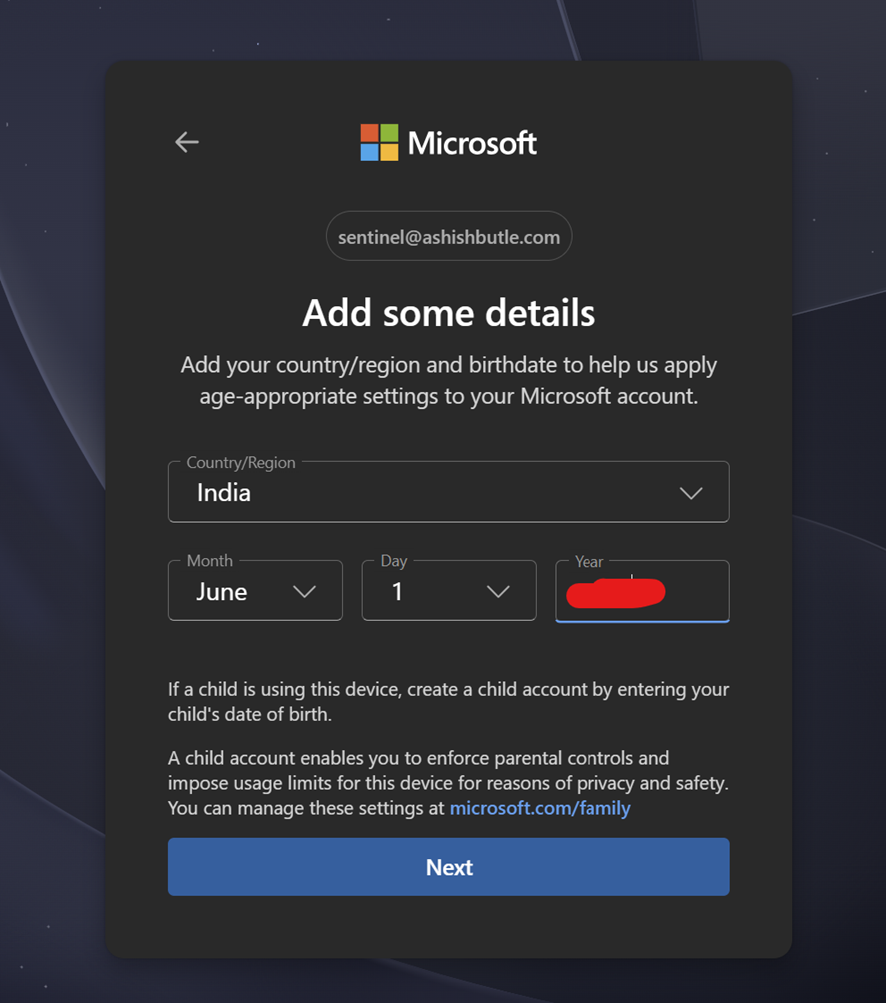
Access Azure PortalNavigate to portal.azure.com If you don't have an account, click "Create one" to sign up for a free Azure account and follow the Wizard and complete the setup.
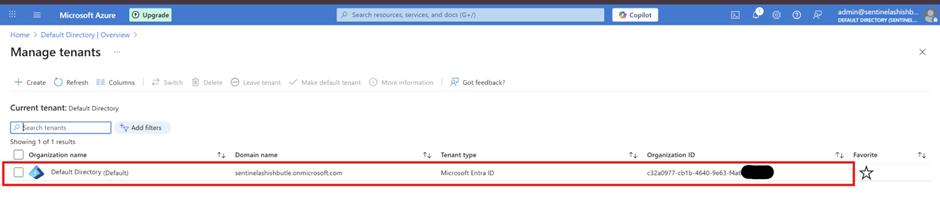
I am currently working within an existing tenant, and all new resources (such as subscriptions, trial licenses, and services) will be associated with this "Default Directory" tenant unless another tenant is provisioned under the correct conditions.
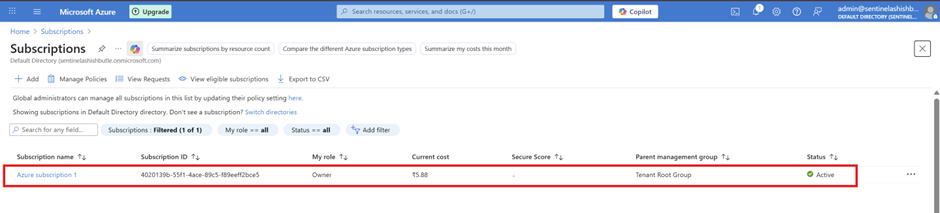
Verify Subscription > Go to Subscriptions in Azure portal > Confirm your subscription is active and shows "Active" status > Note your Subscription ID (you'll need this later)
As you may already know KQL has become the standard for querying large data sets in Azure Log Analytics space. When you have thousands of users who are in Azure AD and when you have MFA and other Conditional Access Policies setup, next thing you will see is tons of sign in logs, activity logs, security logs and events and etc.
What will happen hear is with the help of Azure Log Analytics, Azure AD Sign in logs and Activity Logs, Risky Users, User Risk Events and tons more data can be streamed to an Azure Log Analytics Workspace and from there you can use KQL (Kusto Query Language) to query the necessary information that the standard UI can’t produce.
Phase 2: Setup the Azure Log Analytics Workspace
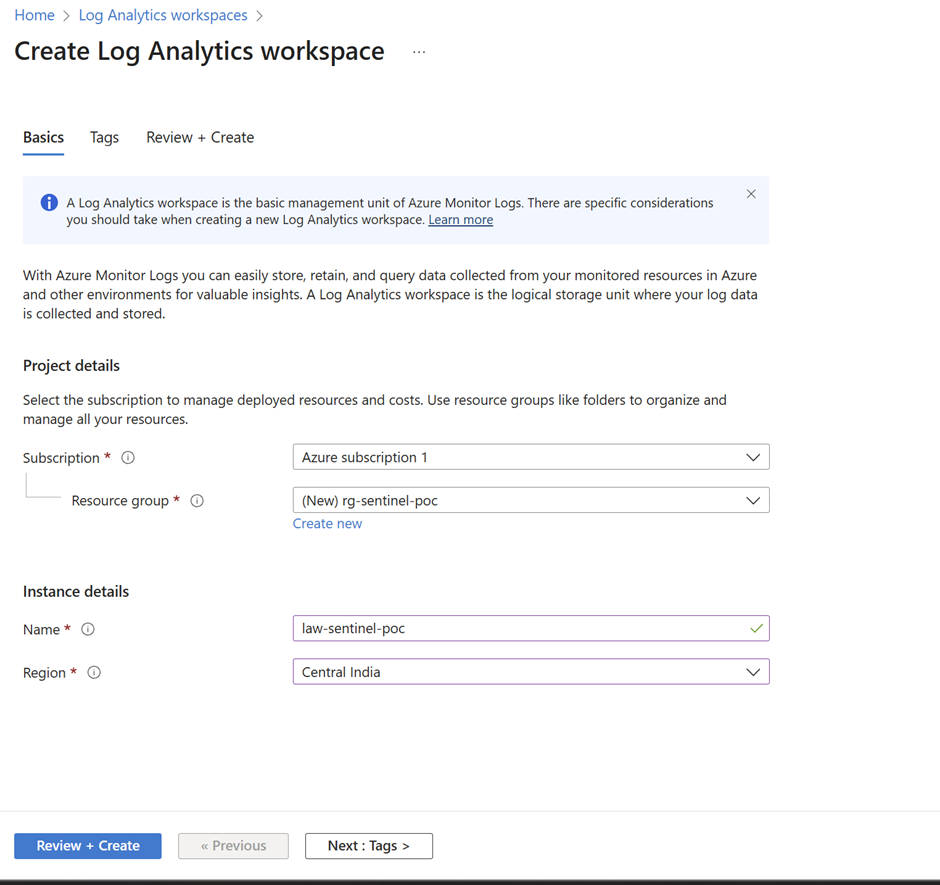
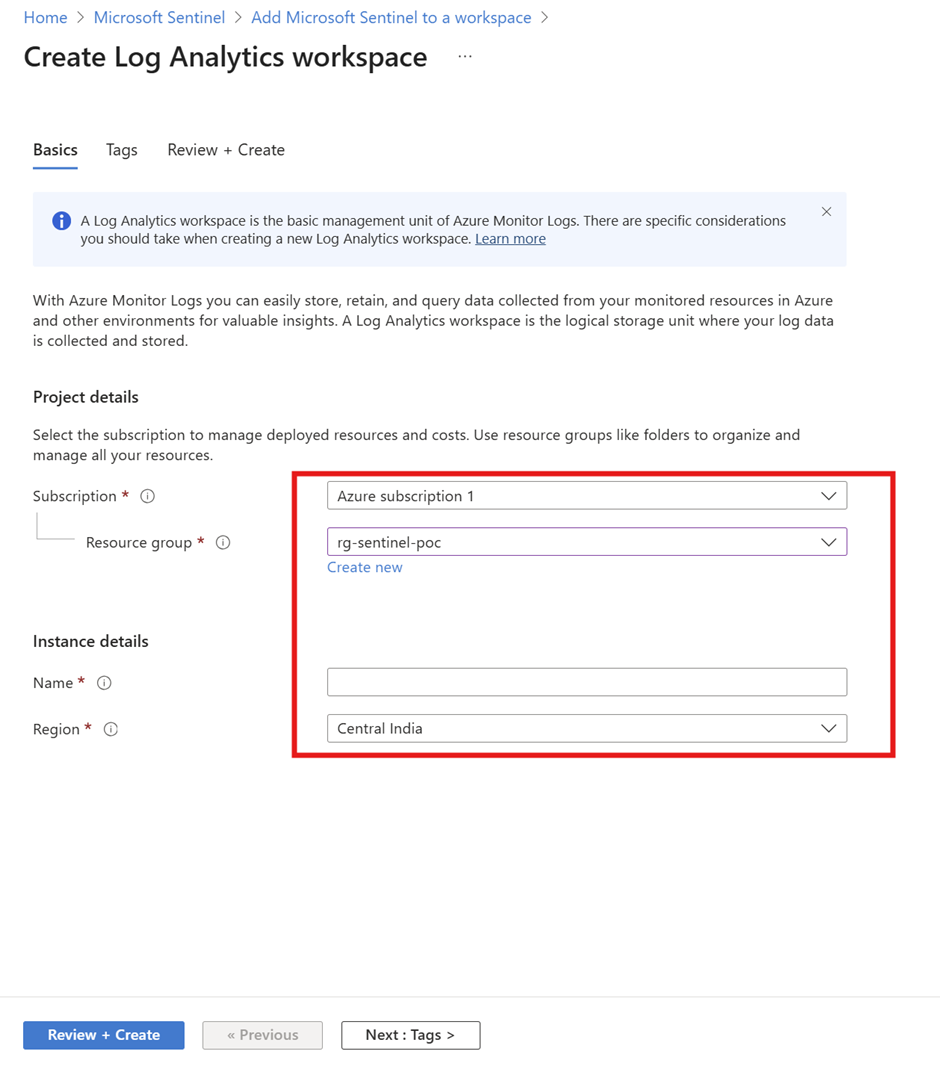
Given you have an Azure subscription, create the Log Analytics Workspace in the relevant resource group or create a new one.
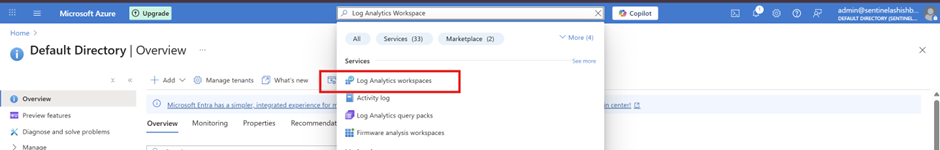
Create a new resource in your resource group. Search for Log Analytics Workspace
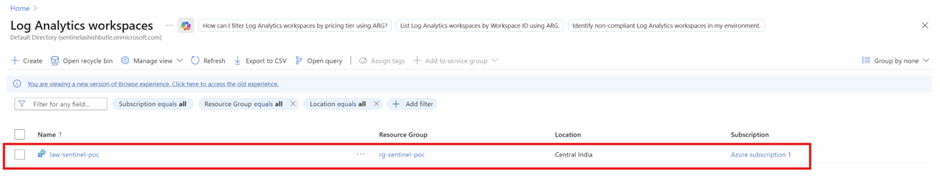
Hit Create and Complete the creation
Connect the Azure AD Logs with the Log Analytics Workspace
This is where you start stream the Azure AD logs to the Log Analytics Workspace you created earlier.
Configure Entra ID Diagnostic Settings
Navigate to Microsoft Entra admin center: ENTRA > Sign in as at least Security Administrator > Browse to Identity > Monitoring & health > Diagnostic settings
Create Diagnostic Setting
Click + Add diagnostic setting > Configure the setting>Diagnostic setting name: Enter descriptive name (e.g., "EntraID-to-Sentinel") > Category details Select ALL log categories
Set the name (Diagnostic setting name), select the required Logs categories, and select the Azure Subscription and the created Log Analytics Workspace
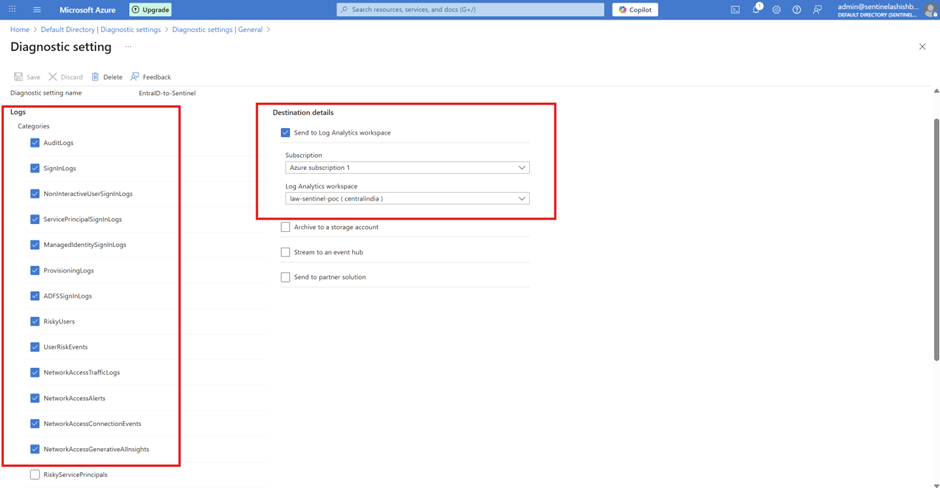
Once you press Save, the data will start stream in to the Log Analytics workspace and will be all ready to go in few minutes time.
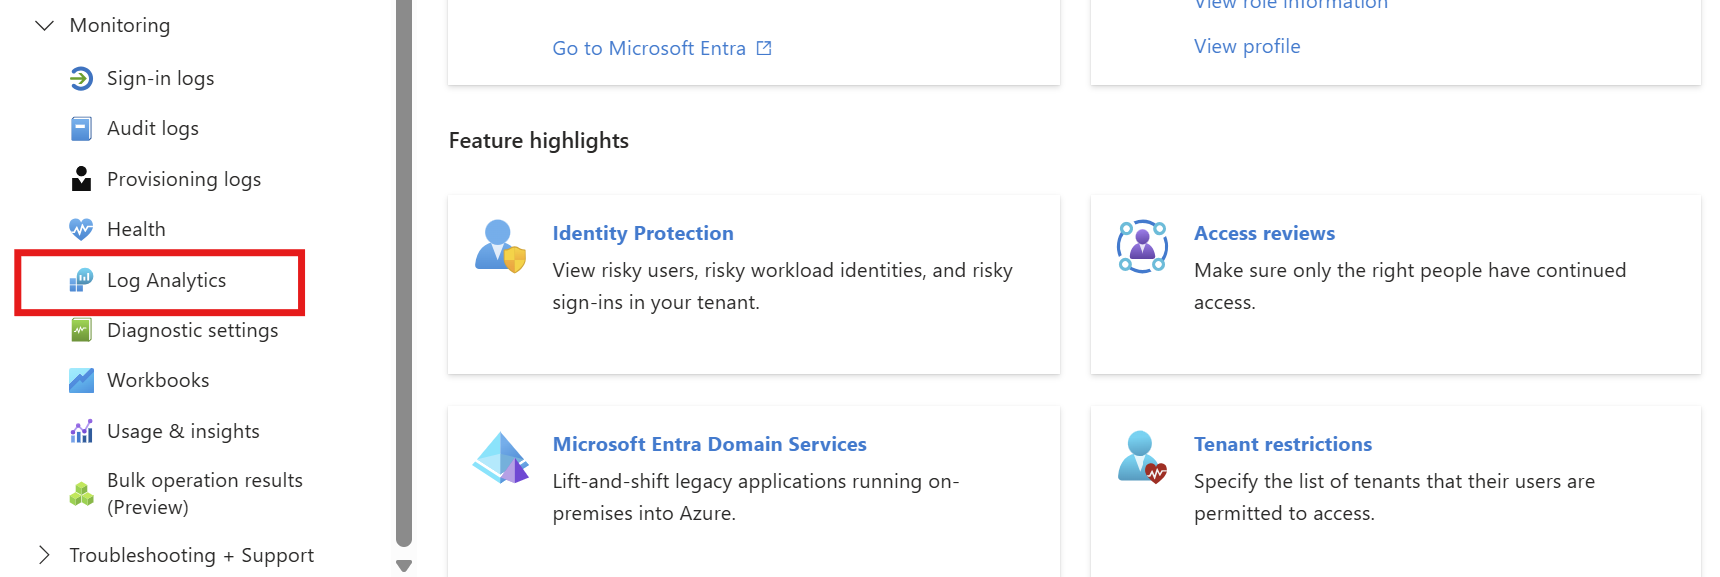
You can easily go to the Azure Log Analytics workspace straight from the Azure AD. Click on Log Analytics in Azure Active Directory
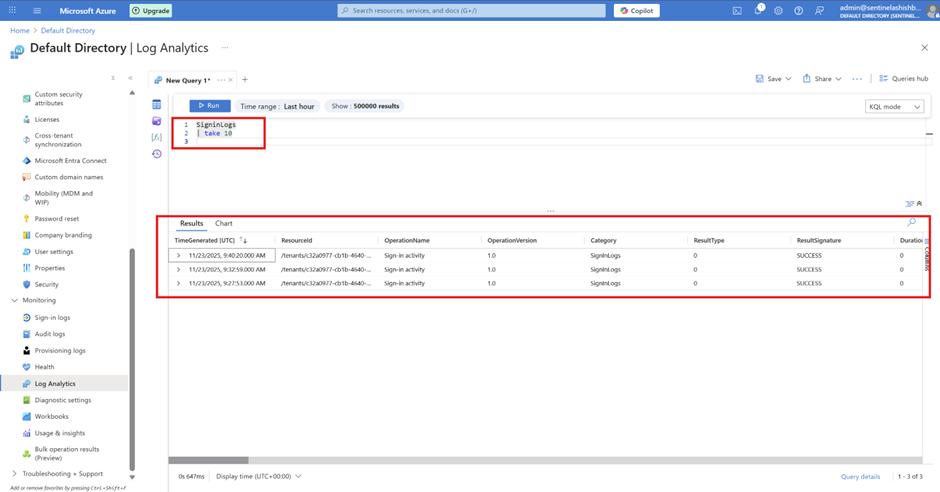
And you will see below. This is the space where you run all the queries using KQL (Kusto Query Language) and get your results.
SigninLogs | take 10Kusto Query Language
Phase 3: Create and Configure Microsoft Sentinel "The All-Seeing Eye"
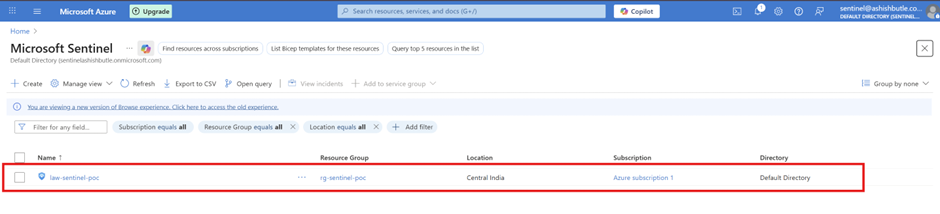
In Azure portal, search for "Microsoft Sentinel > Click Microsoft Sentinel > Click + Create
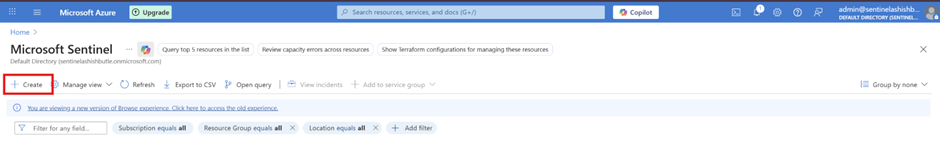
The workspace is now enabled for Microsoft Sentinel
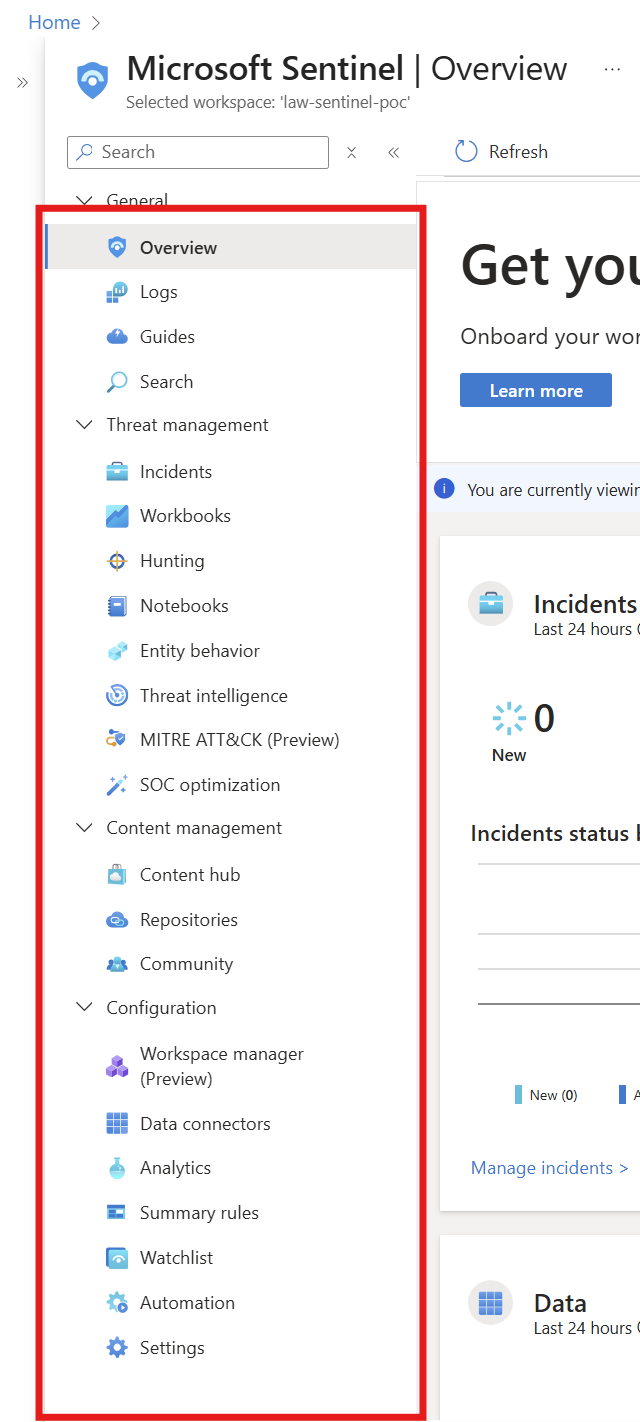
Here’s the Microsoft Sentinel menu and terminology you’ll be forced to interact with whether you actually want to or not.
Overview : A dashboard that shows the overall security status, alerts, and activity at a glance.
Logs: Where you run queries to search event data collected from systems and services.
Incidents: Shows security incidents that Sentinel has detected and grouped for investigation.
Workbooks: Prebuilt or custom dashboards that visualize security data and trends.
Hunting: Tools and queries for proactively searching for threats that may not be alerted yet.
Notebooks: Interactive investigation using Python and data analysis for deeper security research.
Entity behavior: Displays activity patterns for users, devices, IPs, and accounts to detect unusual behavior.
Threat intelligence: A place to import and manage known malicious indicators such as bad IPs, domains, and hashes.
MITRE ATT&CK: Maps alerts and techniques to the MITRE attack framework to understand attack stages.
Content hub: A catalog where you can install additional analytics rules, connectors, workbooks, and solutions.
Data connectors: Where you connect data sources like Microsoft 365, Defender, AD, firewalls, and servers.
Analytics: The rules that generate alerts when suspicious or risky activity is detected.
Watchlist: Upload reference lists (IPs, users, assets, tags) that can be used in detection rules.
Automation: Create automated response actions using playbooks (Logic Apps).
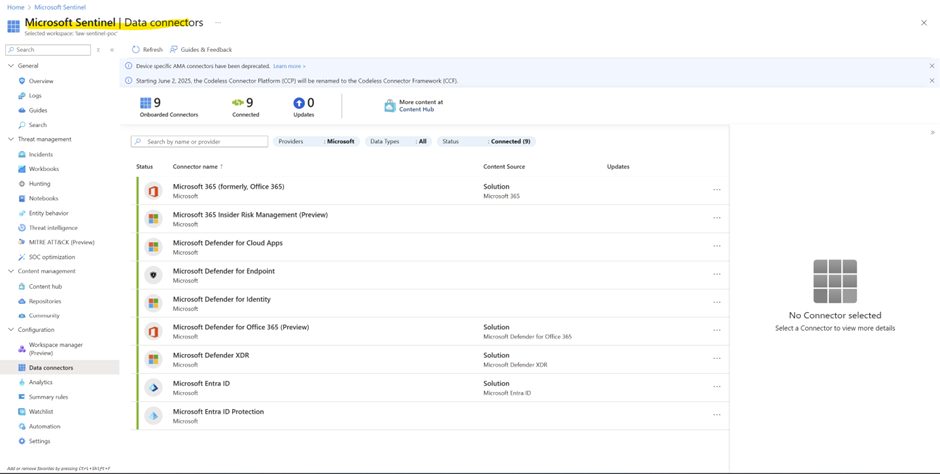
Phase 4: Configure Sentinel Data Connectors "Plugging Everything In"
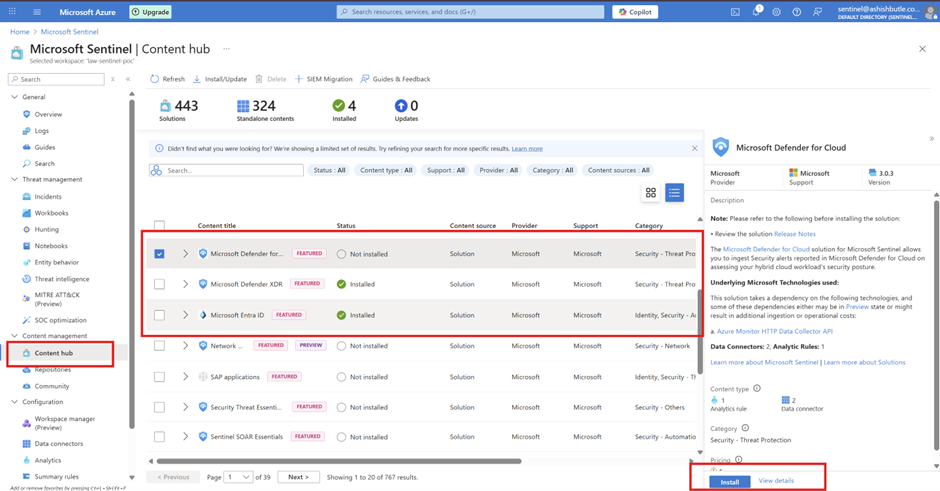
Install Microsoft 365 Solution from Content Hub
• In Microsoft Sentinel, navigate to Content hub
• Search for "Microsoft 365"
• Install the following solutions:
• Microsoft 365 (includes Office 365 connector)
• Microsoft Defender XDR (includes all Defender connectors)
• Azure Active Directory (includes Entra ID connector)
• Click Install for each solution
• Wait for installation to complete
From Here we can enable and disable connecter
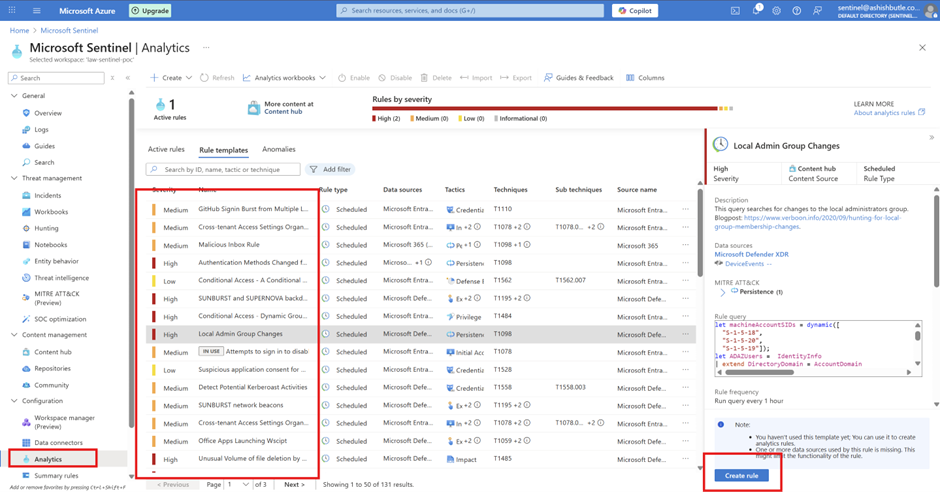
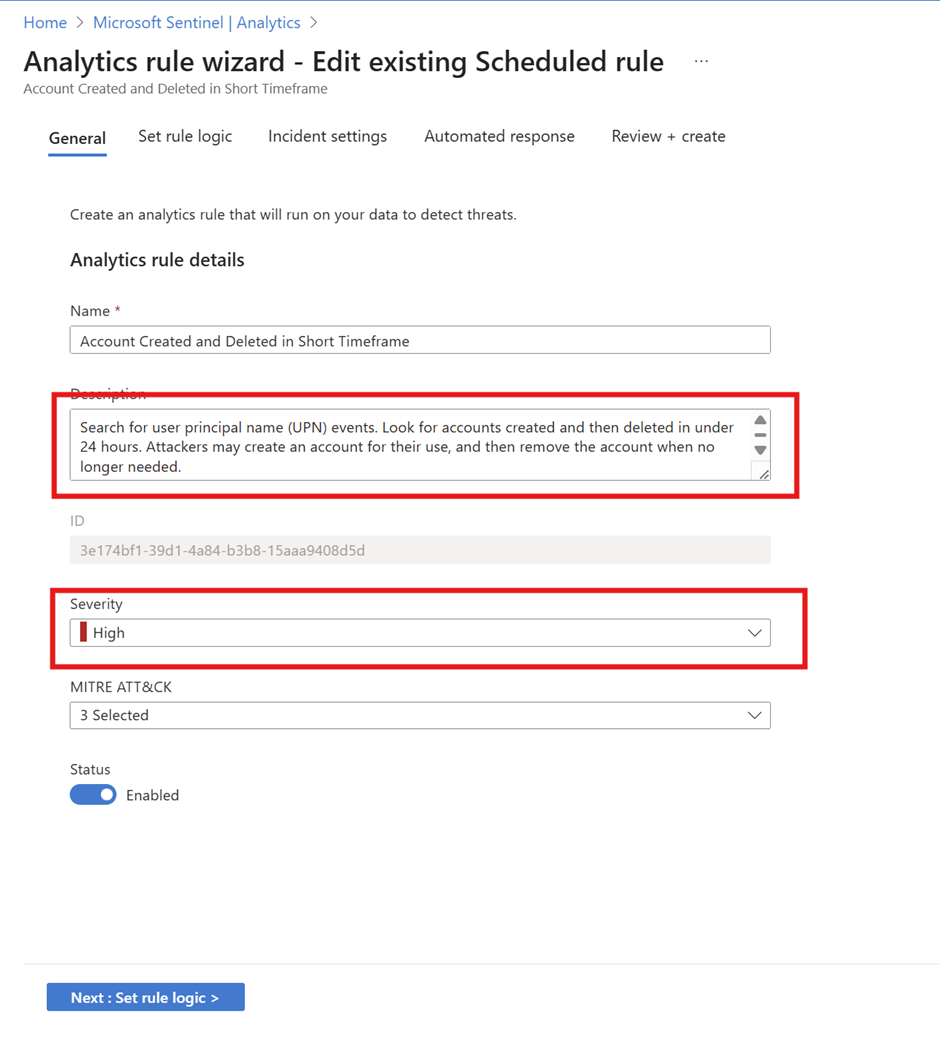
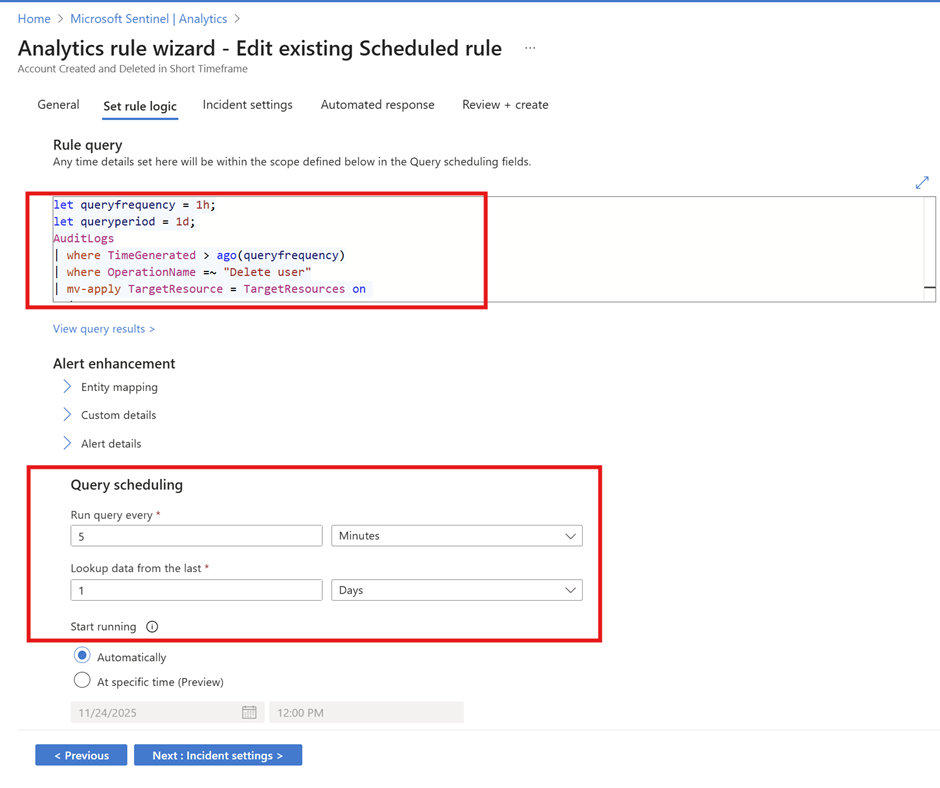
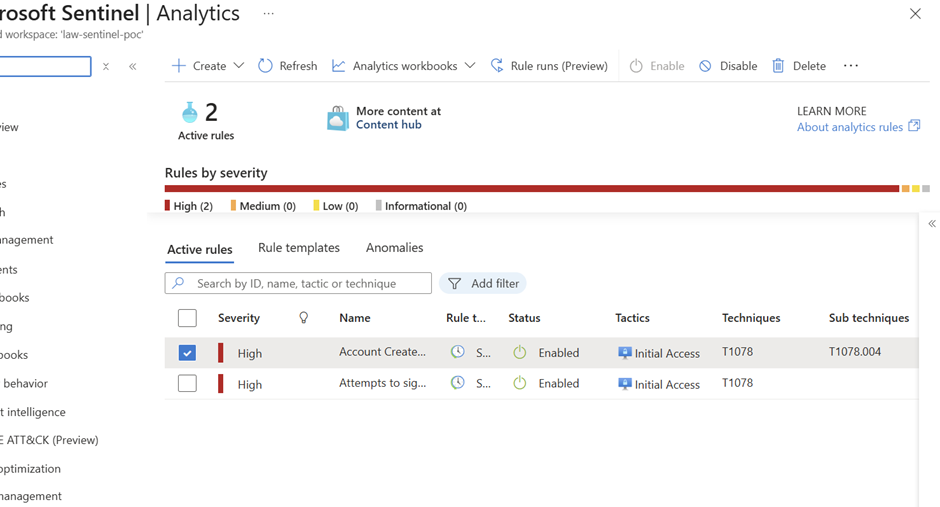
Phase 5: Analytics Rules – Teaching Sentinel What "Weird" Looks Like
This are the Native Rule we can enable as per business requirement and we can create as per business requirment.
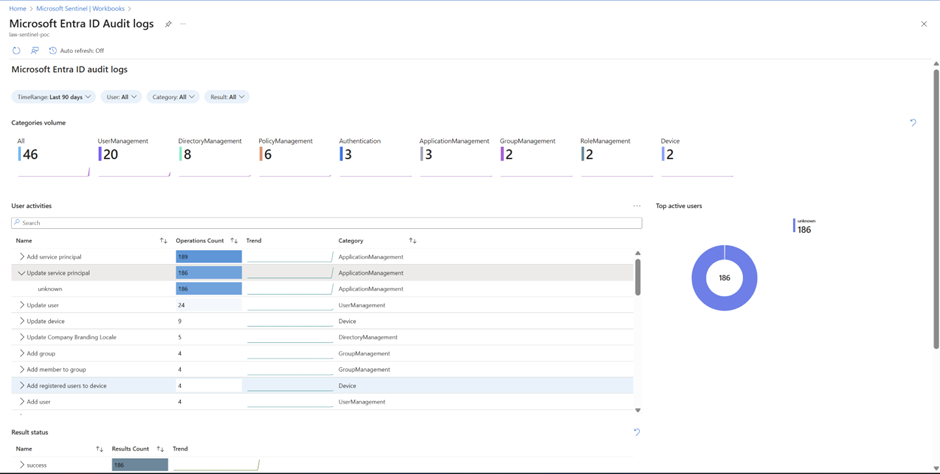
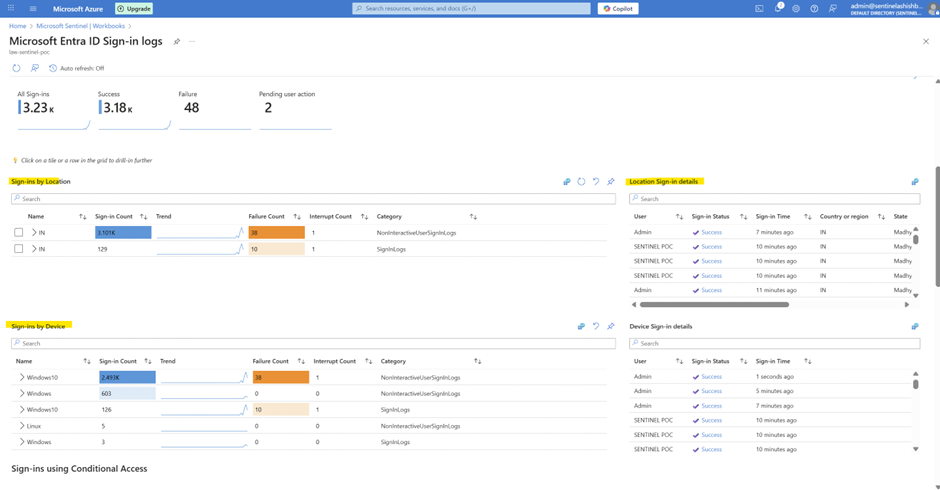
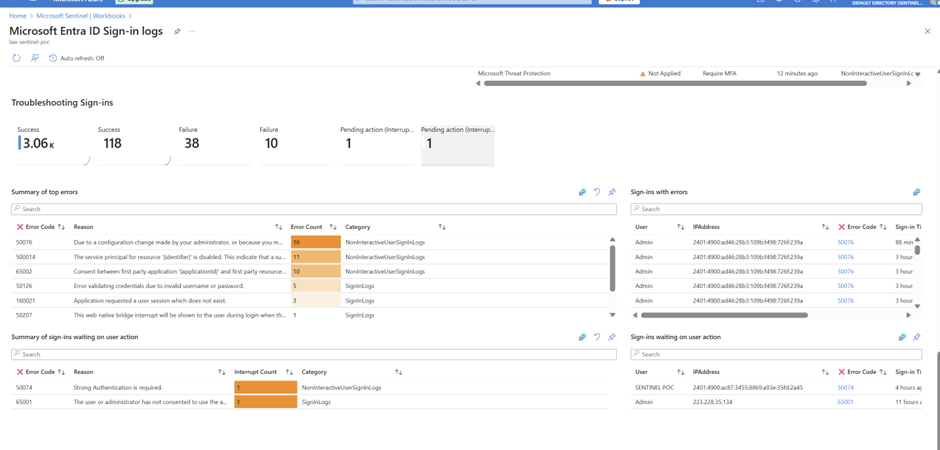
Phase 6: Workbooks – The Pretty Dashboard for Management
Workbooks for MS Entra Audit Logs
Workbooks for MS Entra Sign in Logs
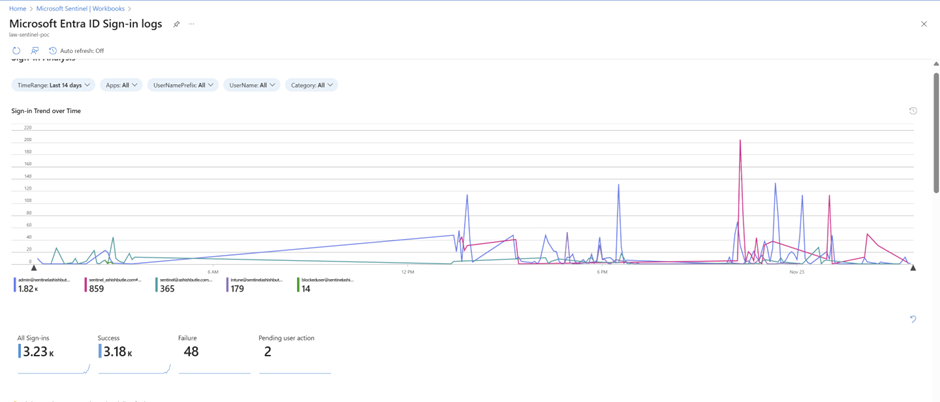
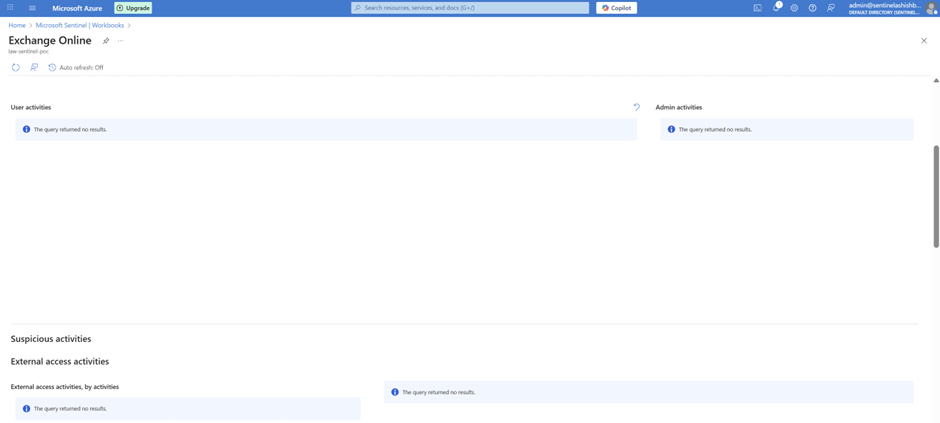
As I am having only Business Premium license due to License Limitation not able to see exchange audit admin logs.
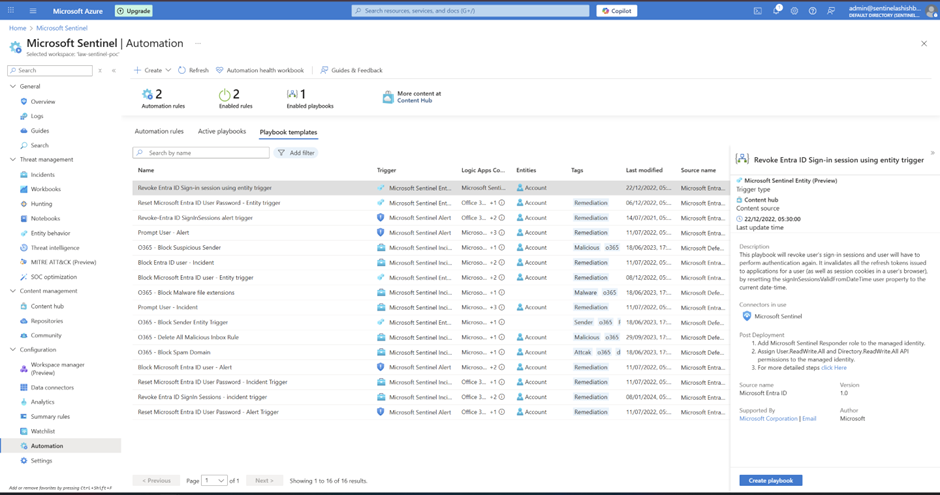
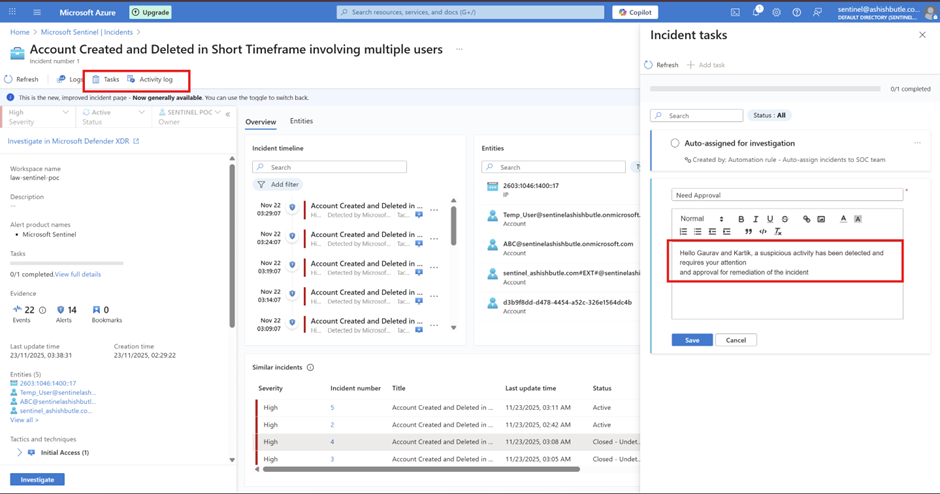
Phase 7: Automation – Because We're Lazy (Efficiently)
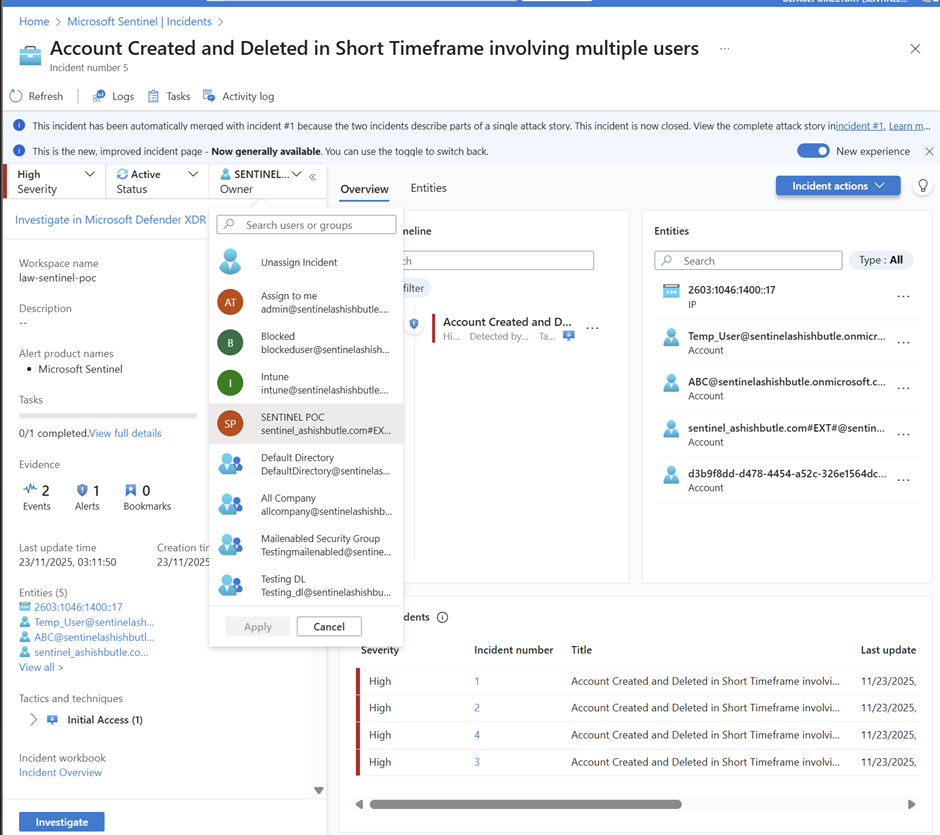
Set up automation rules so when an alert fires, it automatically:
Sends an email to the SOC team (that's us) > Assigns the incident to the right person > Creates a task or ticket if needed.
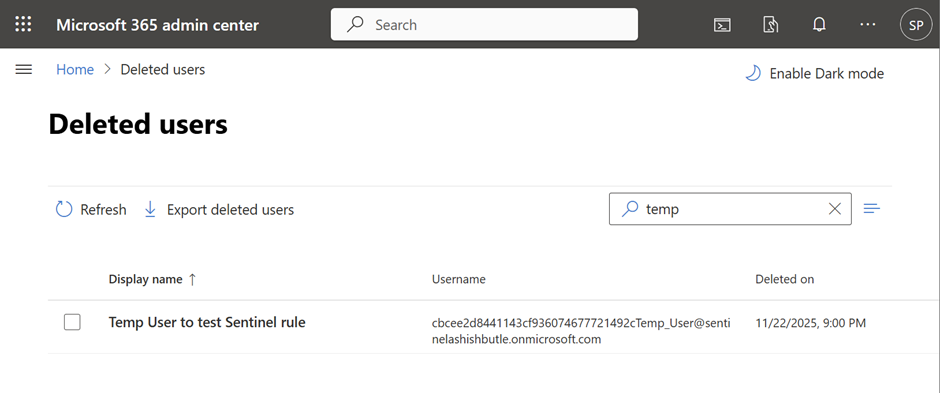
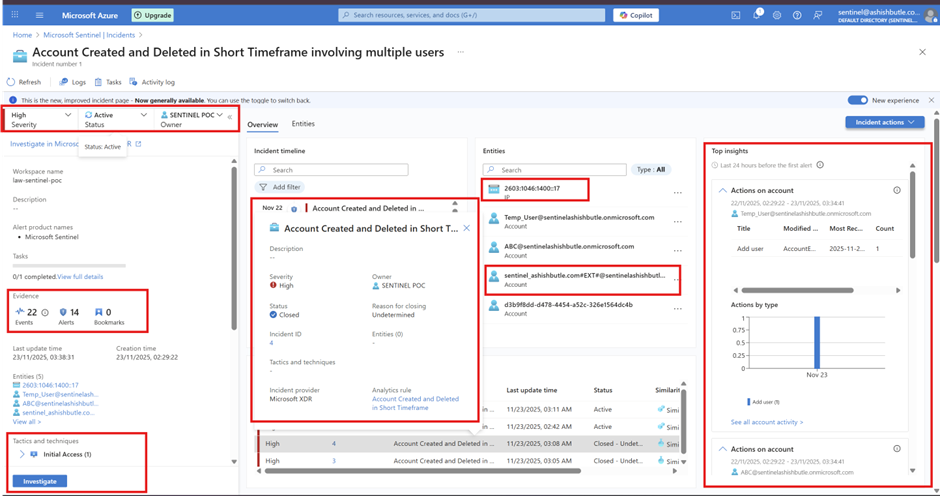
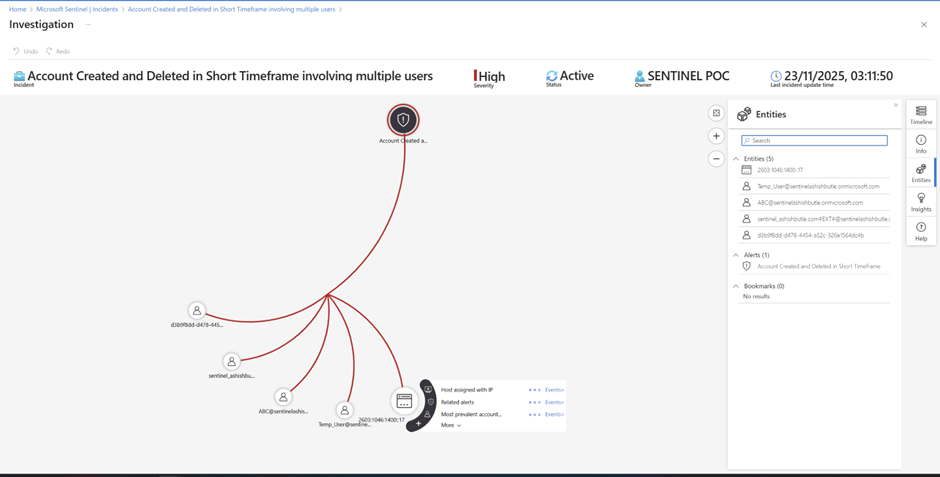
Phase 8: Testing Analytics – Breaking Stuff On Purpose
Simulated "bad guy" behavior:
Created/deleted accounts rapidly.
Phase 9 : Testing KQL query examples for Microsoft Entra ID with Log Analytics
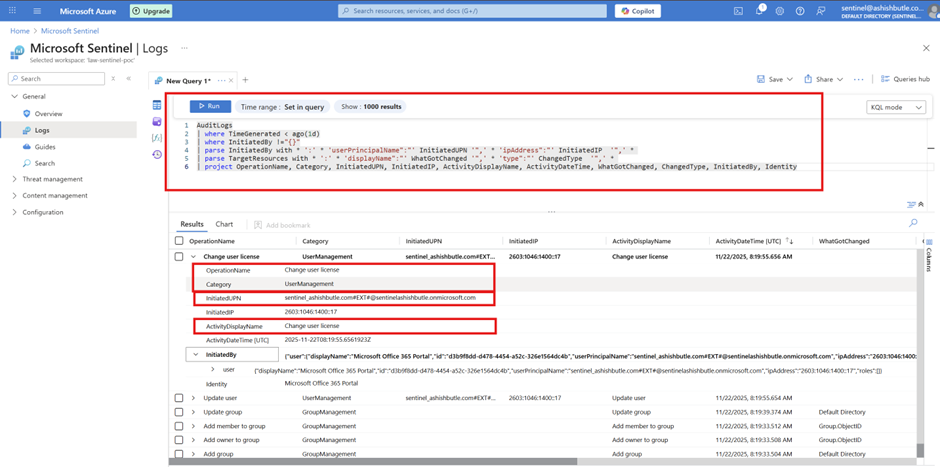
Below is just a simple query to query the AuditLogs table and to understand the activities performed for Azure AD identity and Access Management features
KQL: AuditLogs
AuditLogs
| where TimeGenerated < ago(1d)
| where InitiatedBy !="{}"
| parse InitiatedBy with * ':' * 'userPrincipalName":"' InitiatedUPN '",' * 'ipAddress":"' InitiatedIP  '",' *
| parse TargetResources with * ':' * 'displayName":"' WhatGotChanged '",' * 'type":"' ChangedType  '",' *
| project OperationName, Category, InitiatedUPN, InitiatedIP, ActivityDisplayName, ActivityDateTime, WhatGotChanged, ChangedType, InitiatedBy, Identity
KQL For Admin activity capture
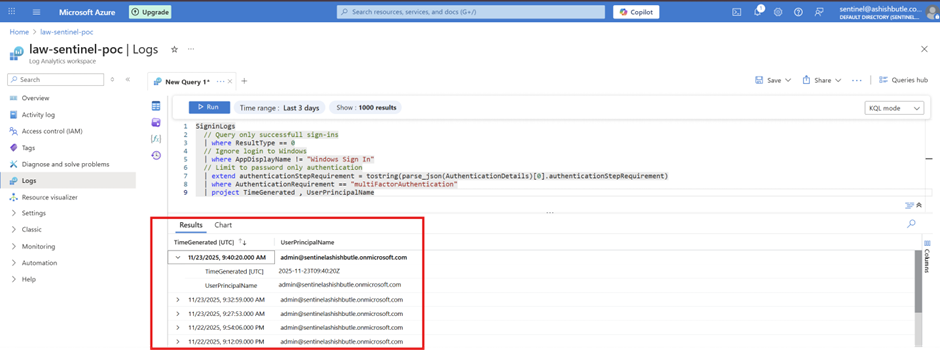
KQL: List sign-ins with MFA
SigninLogs
  // Query only successfull sign-ins
  | where ResultType == 0
  // Ignore login to Windows
  | where AppDisplayName != "Windows Sign In"
  // Limit to password only authentication
  | extend authenticationStepRequirement = tostring(parse_json(AuthenticationDetails)[0].authenticationStepRequirement)
  | where AuthenticationRequirement == "multiFactorAuthentication"
  | project TimeGenerated , UserPrincipalName
Pull sign-ins with MFA
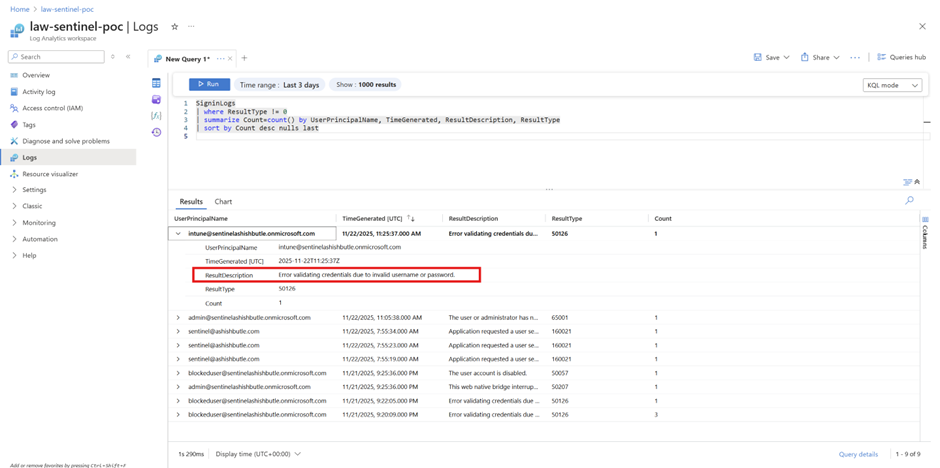
KQL: List number of failed sign-ins with their reasons
SigninLogs
| where ResultType != 0
| summarize Count=count() by UserPrincipalName, TimeGenerated, ResultDescription, ResultType
| sort by Count desc nulls last
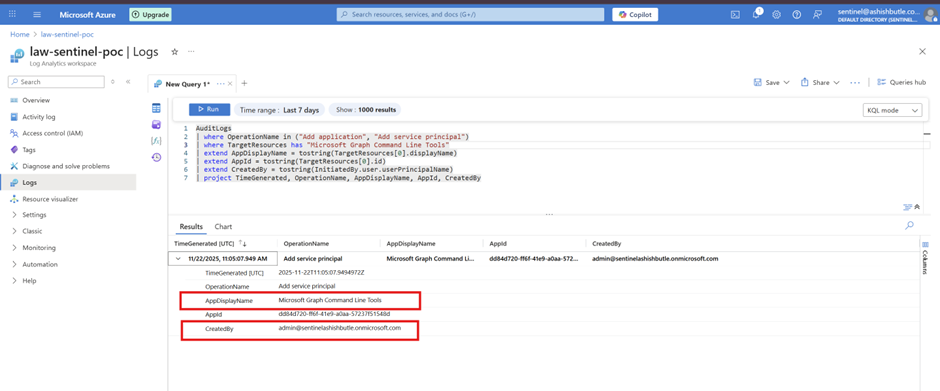
KQL: List who has added an application in Entra ID
AuditLogs
| where TimeGenerated >= ago(1000d)
| where OperationName in ("Add application", "Add service principal")
| where TargetResources has "Your app name"
| extend AppDisplayName = tostring(TargetResources[0].displayName)
| extend AppId = tostring(TargetResources[0].id)
| extend CreatedBy = tostring(InitiatedBy.user.userPrincipalName)
| project TimeGenerated, OperationName, AppDisplayName, AppId, CreatedBy
Bonus: With KQL we can do lots of out of the box thing's, and also Next weekend, I’ll try to ingest on-prem Linux and Windows server logs for threat hunting and threat intelligence